Forecasting
 Source: Calvin and Hobbes via GoComics
Back when I was a consultant, I built countless Excel forecasts—revenues, retention, GDP growth—but rarely learned if they were accurate. This experience of flying blind, and operating without feedback, was a powerful motivator that pushed me to find methods and communities focused on rigorously scored and calibrated forecasting, where the goal wasn’t just projection, but reliable accuracy.
This discipline—call it forecasting, prediction, or estimation—has had a formalized community for a while now, complete with forecasting competitions, dedicated groups like Samotsvety, and even its own forecasting conference. And it’s not just theoretical; prediction markets like Kalshi had very liquid markets correctly calling Trump’s election win, with just one person betting as much as $45mn on that outcome.
So how do the best forecasters do it, and can their habits be translated into heuristics we can use on any question that matters? This post is my attempt to pin down heuristics I’ve come across so far.
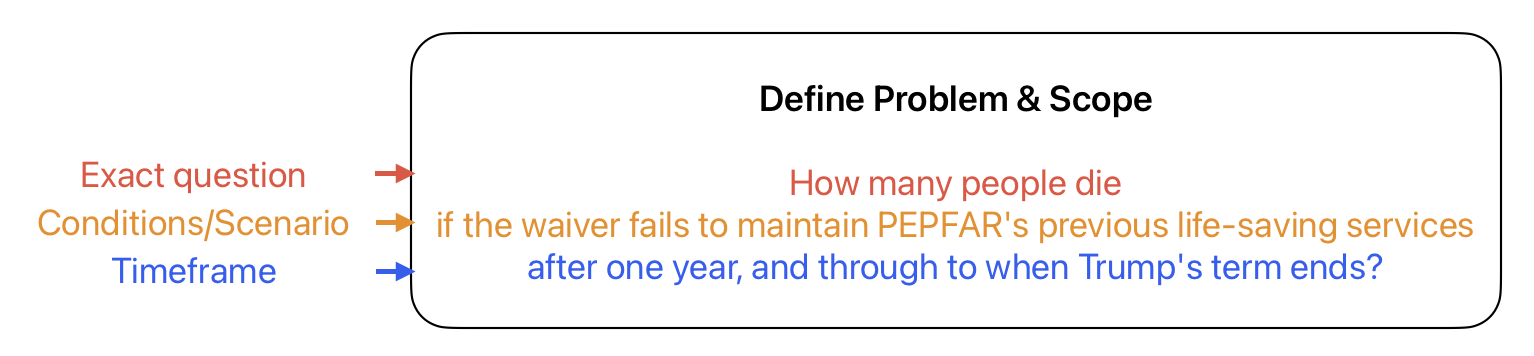
My thinking on writing down forecasting heuristics crystallized after diving into a series by Asterisk Magazine. They commissioned detailed forecasts on a critical issue: the potential excess deaths resulting from funding cuts to five major USAID programs:
- PEPFAR, by Jared Leibowich
- Malaria, by Bruce Tsai
- Severe acute malnutrition, by Anna Gordon & Lauren Gilbert
- Tuberculosis, by Kati Conen
- Water, sanitation, and hygiene, by Erin Braid
Examining these forecasts revealed a bunch of commonalities in their structure and analytical approach. I’ve distilled these into the meta-structure diagrammed below. While the steps might seem intuitive, having this framework explicit can be incredibly helpful when tackling any complex estimation or forecasting challenge.
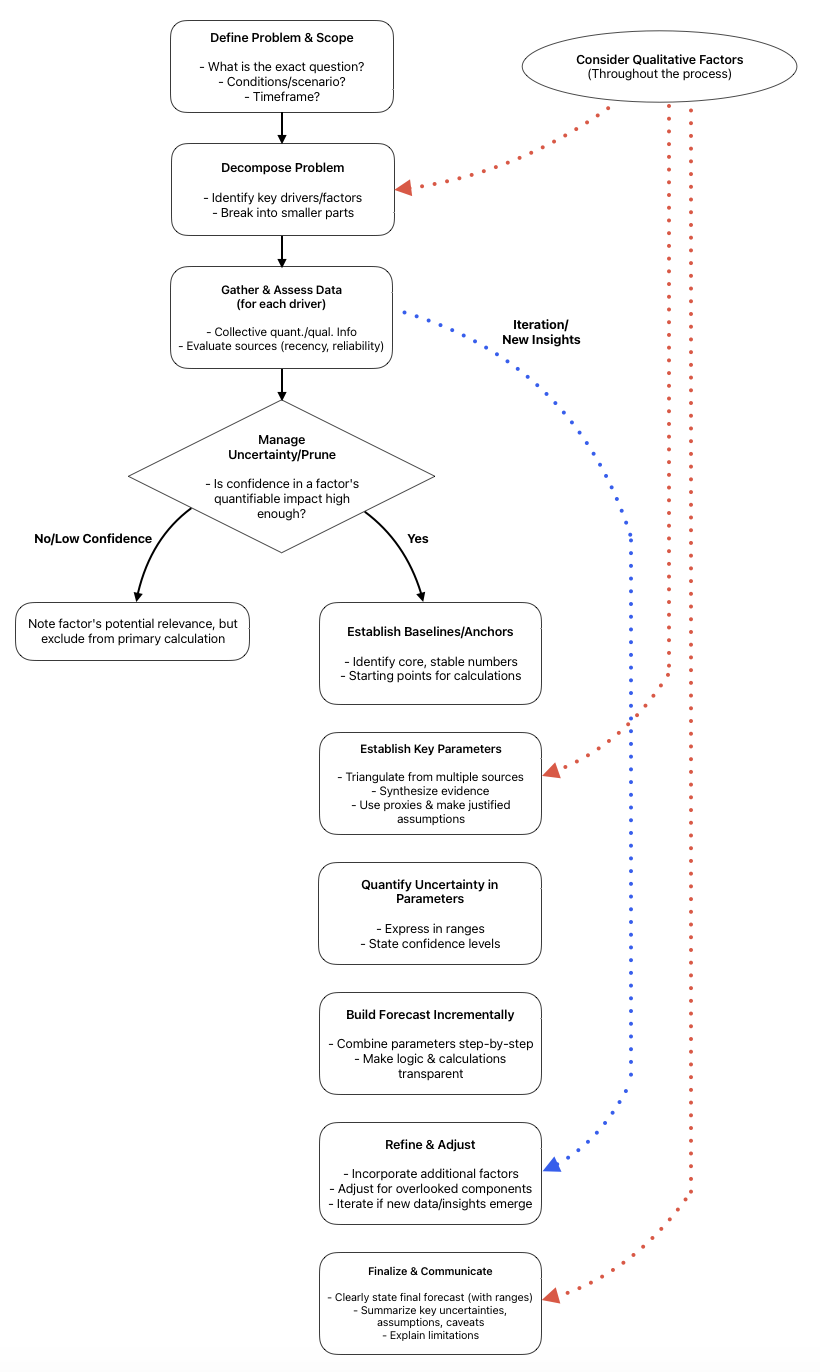
Let’s walk through these heuristics using the PEPFAR forecast as an example.
Define Problem & Scope
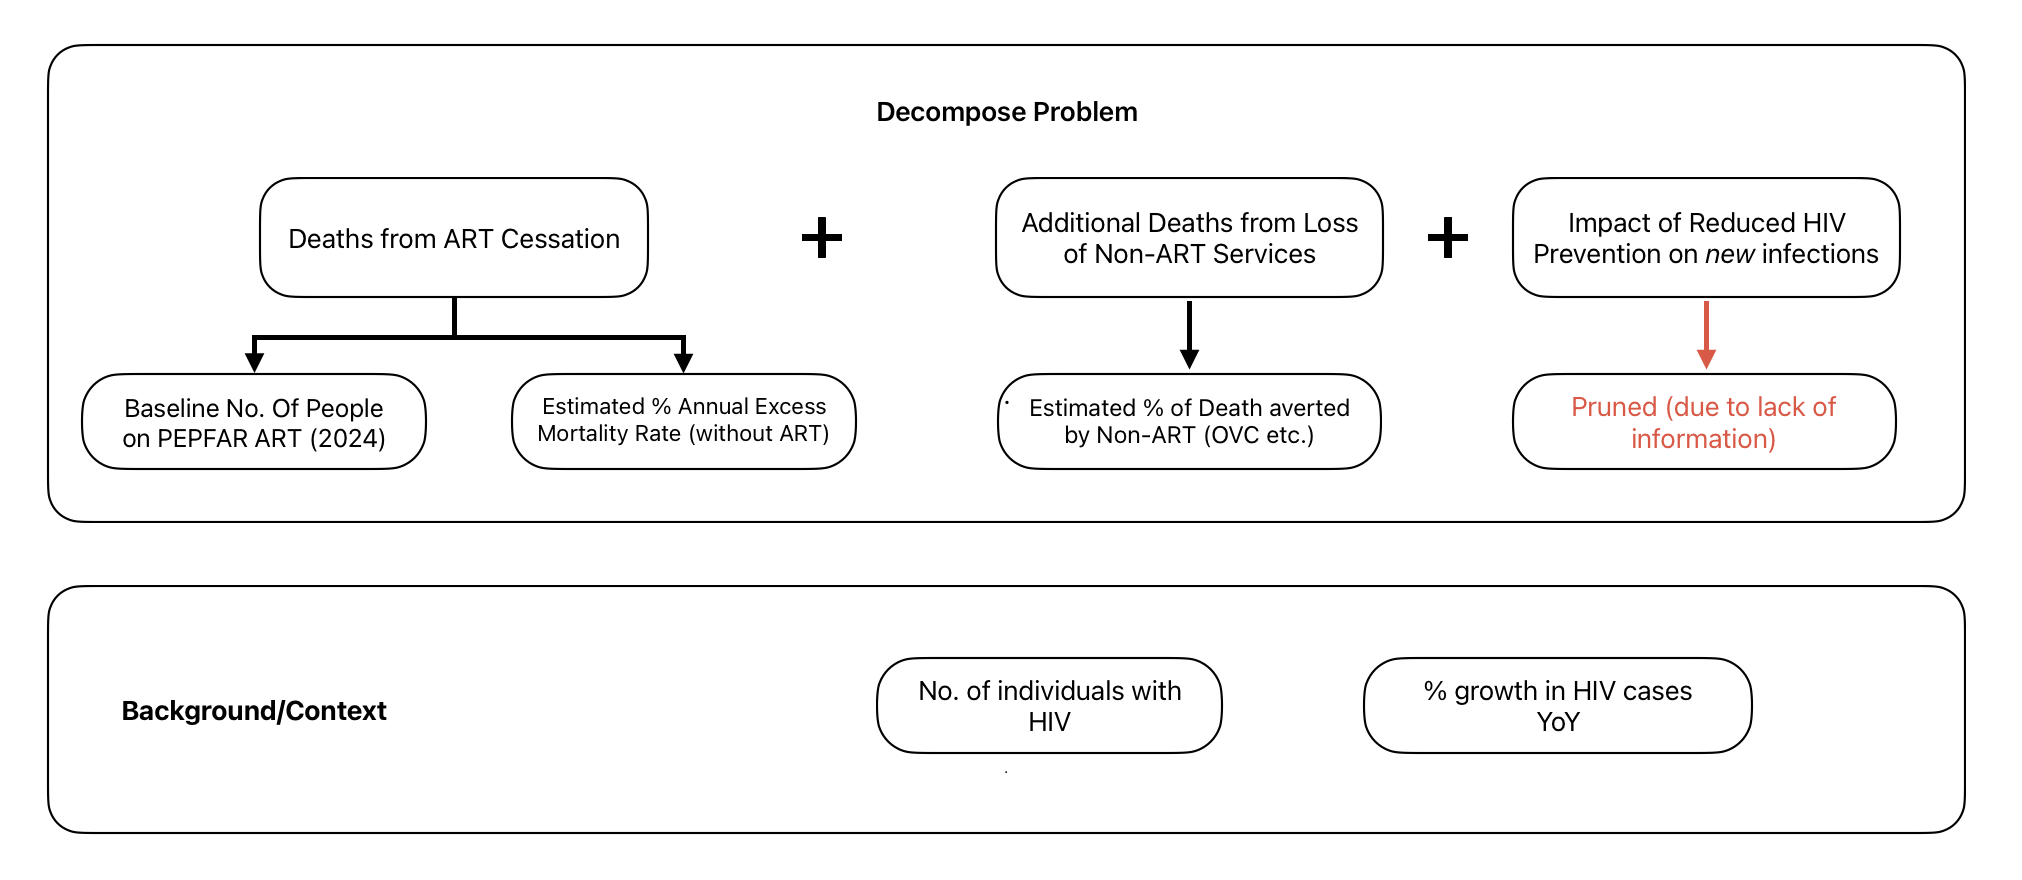
Decompose Problem
Gather & Assess Data
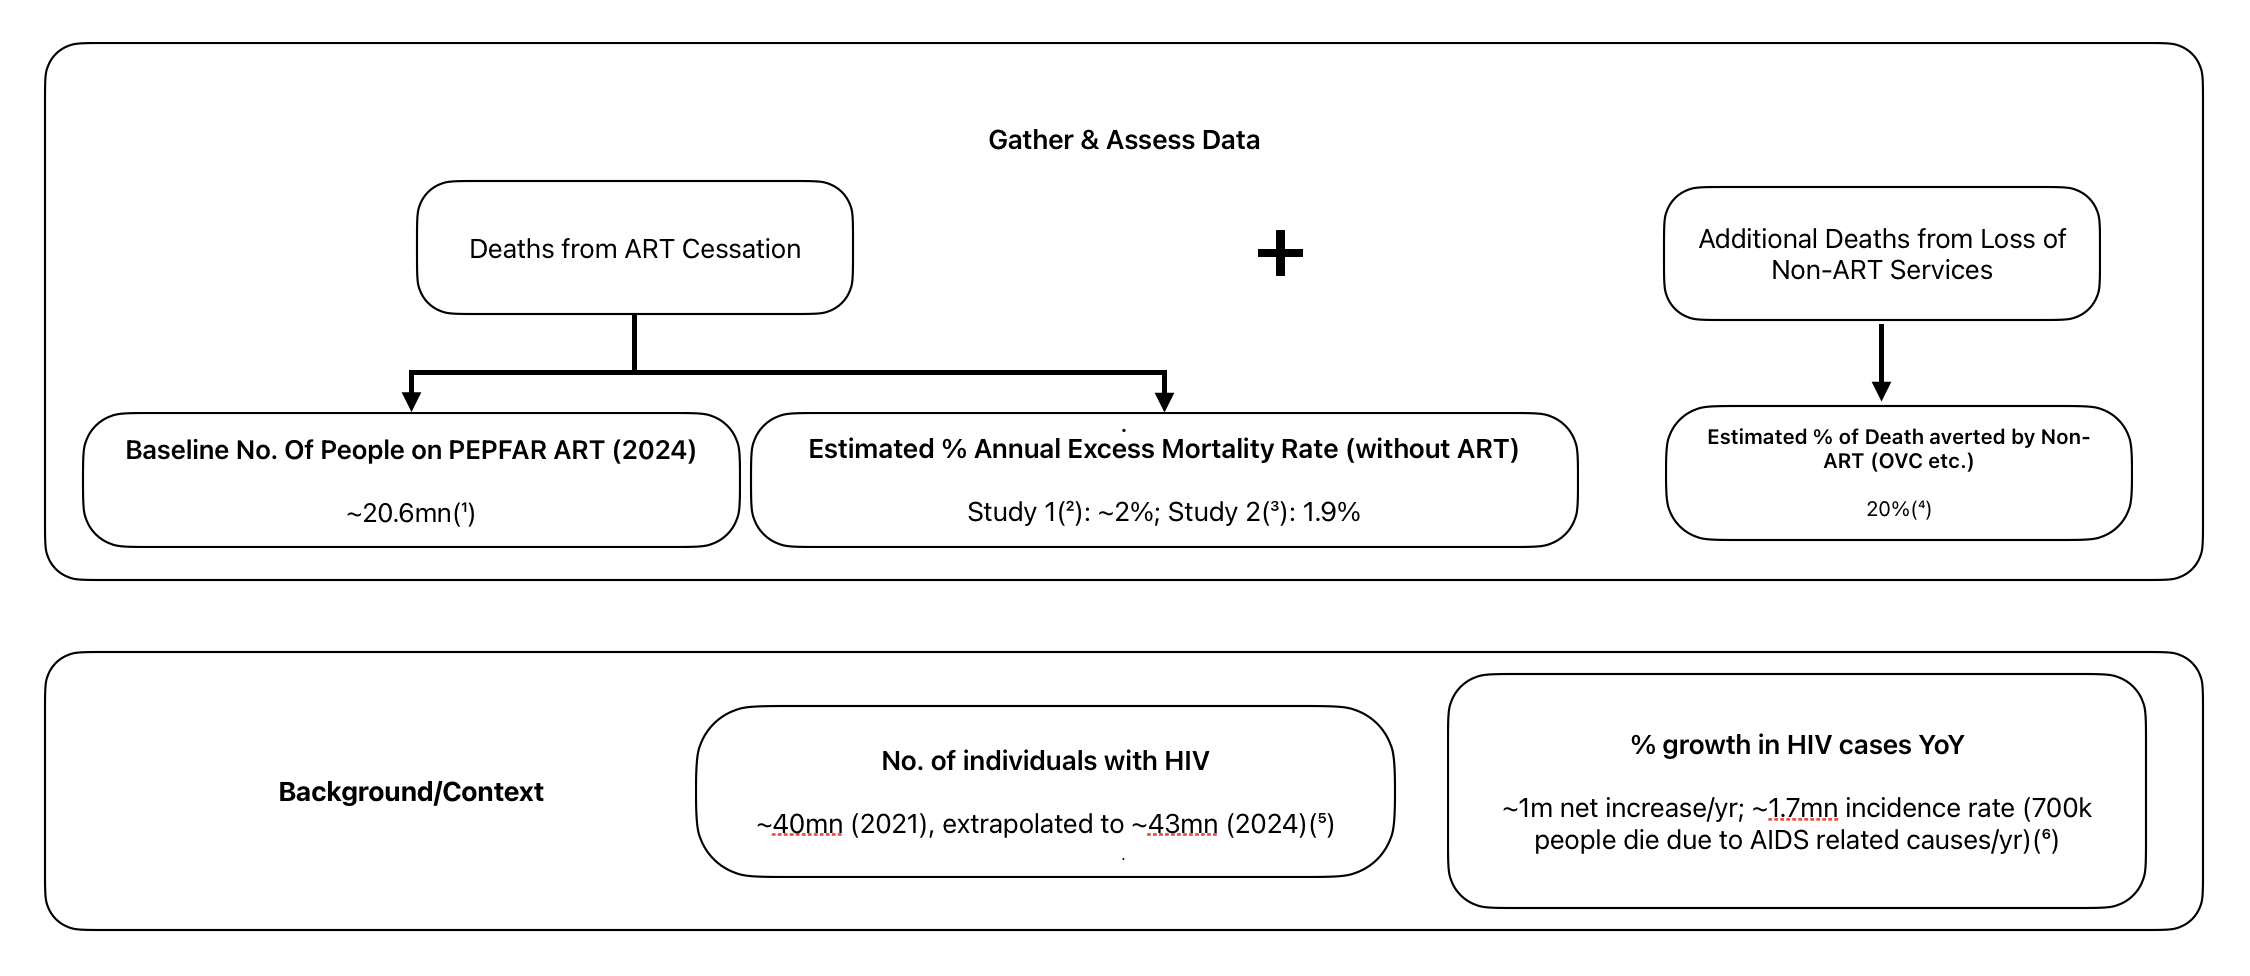
(1) : PEPFAR Latest Global Results & Projections Factsheet (Dec. 2024)
Quick Note on CD4 and why it matters: CD4+ T-lymphocytes are critical cells of the immune system that HIV preferentially infects and destroys. In a healthy individual, CD4 counts typically range from 500 to 1,500 cells per cubic millimeter of blood (cells/mm³). As HIV progresses, these counts decline, indicating a weakening immune system. A diagnosis of AIDS is often made when CD4 counts fall below 200 cells/mm³, or when an individual develops specific opportunistic illnesses. The primary goal of ART is to suppress HIV replication, which allows the CD4 count to recover or stabilize, thereby preventing the progression to AIDS and significantly reducing the risk of death. Interrupting ART leads to a rebound in the virus and a subsequent decline in CD4 counts, re-exposing the individual to increased risk.
(2) : CD4+ count-guided interruption of antiretroviral treatment. This trial explored a strategy where adults with CD4 counts above 350 cells/mm³ paused ART, restarting only if their CD4 count dropped below 250 cells/mm³. This approach resulted in approximately two to three extra deaths for every 100 people over a 16-month period, which annualizes to an excess mortality of around 2%. This highlights the risk even in a ‘managed’ interruption scenario for those with relatively higher CD4 counts initially.
(3) : Interruption of combination antiretroviral therapy and risk of clinical disease progression to AIDS or death Another study looking at broader interruptions of ART found an excess mortality rate of 1.9%. This reinforces the finding that stopping effective treatment leads to a measurable increase in deaths.
(4) : PEPFAR’s budget isn’t 100 % ART: 55 % goes to treatment (ART), 10 % to orphans & vulnerable children (OVC), 15 % to palliative care, 20 % to prevention. If you assume OVC funding is as effective at saving lives as ART, then the combined life-saving budget is 55 % + 10 % = 65 % of total funds. ART alone is therefore 55 / 65 ≈ 0.846 (≈ 85 %) of all PEPFAR‐driven lives saved. Leibowich suggests that in practice, ART would account for a bit less than that share, as prevention perhaps would have a minor impact over four years, so we can assume a round number of 80% of lives saved come from ART. This tells us 20% of lives saved are due to non-ART services.
(5) : Our World In Data
(6) : Our World In Data
Qualitative Factors
-
Mechanism of HIV Progression & ART Efficacy: Understanding how HIV impacts the immune system (e.g., CD4 cell decline), how quickly it can progress to AIDS without treatment (mentioning survival times for untreated AIDS), and the fundamental role of Antiretroviral Therapy (ART) in suppressing the virus and improving immune profiles. This underpins the entire rationale for why ART cessation is critical.
-
Risk of HIV Mutation: The high mutation rate of HIV was noted as a significant concern. If individuals on ART are cut off and later resume medication, there’s an increased risk that the virus may have mutated, rendering previous treatments less effective. This also raises concerns about the potential spread of drug-resistant strains.
Manage Uncertainty
Low Confidence
Estimating how many HIV cases PEPFAR prevents each year is highly uncertain: While new HIV infections globally declined significantly from ~3 million in 1997 to 1.65 million by 2021 (with PEPFAR launched in 2003), the trend isn’t straightforward. For instance, new cases plateaued around 2.25 million annually between 2008-2014 before declining again, despite ongoing PEPFAR support. This makes it challenging to isolate PEPFAR’s direct, quantifiable impact on prevented new infections per year from other contributing factors (e.g., other prevention initiatives, or testing/reporting variations) with high confidence. Because any point estimate would be fragile, this metric is excluded from the mortality model.
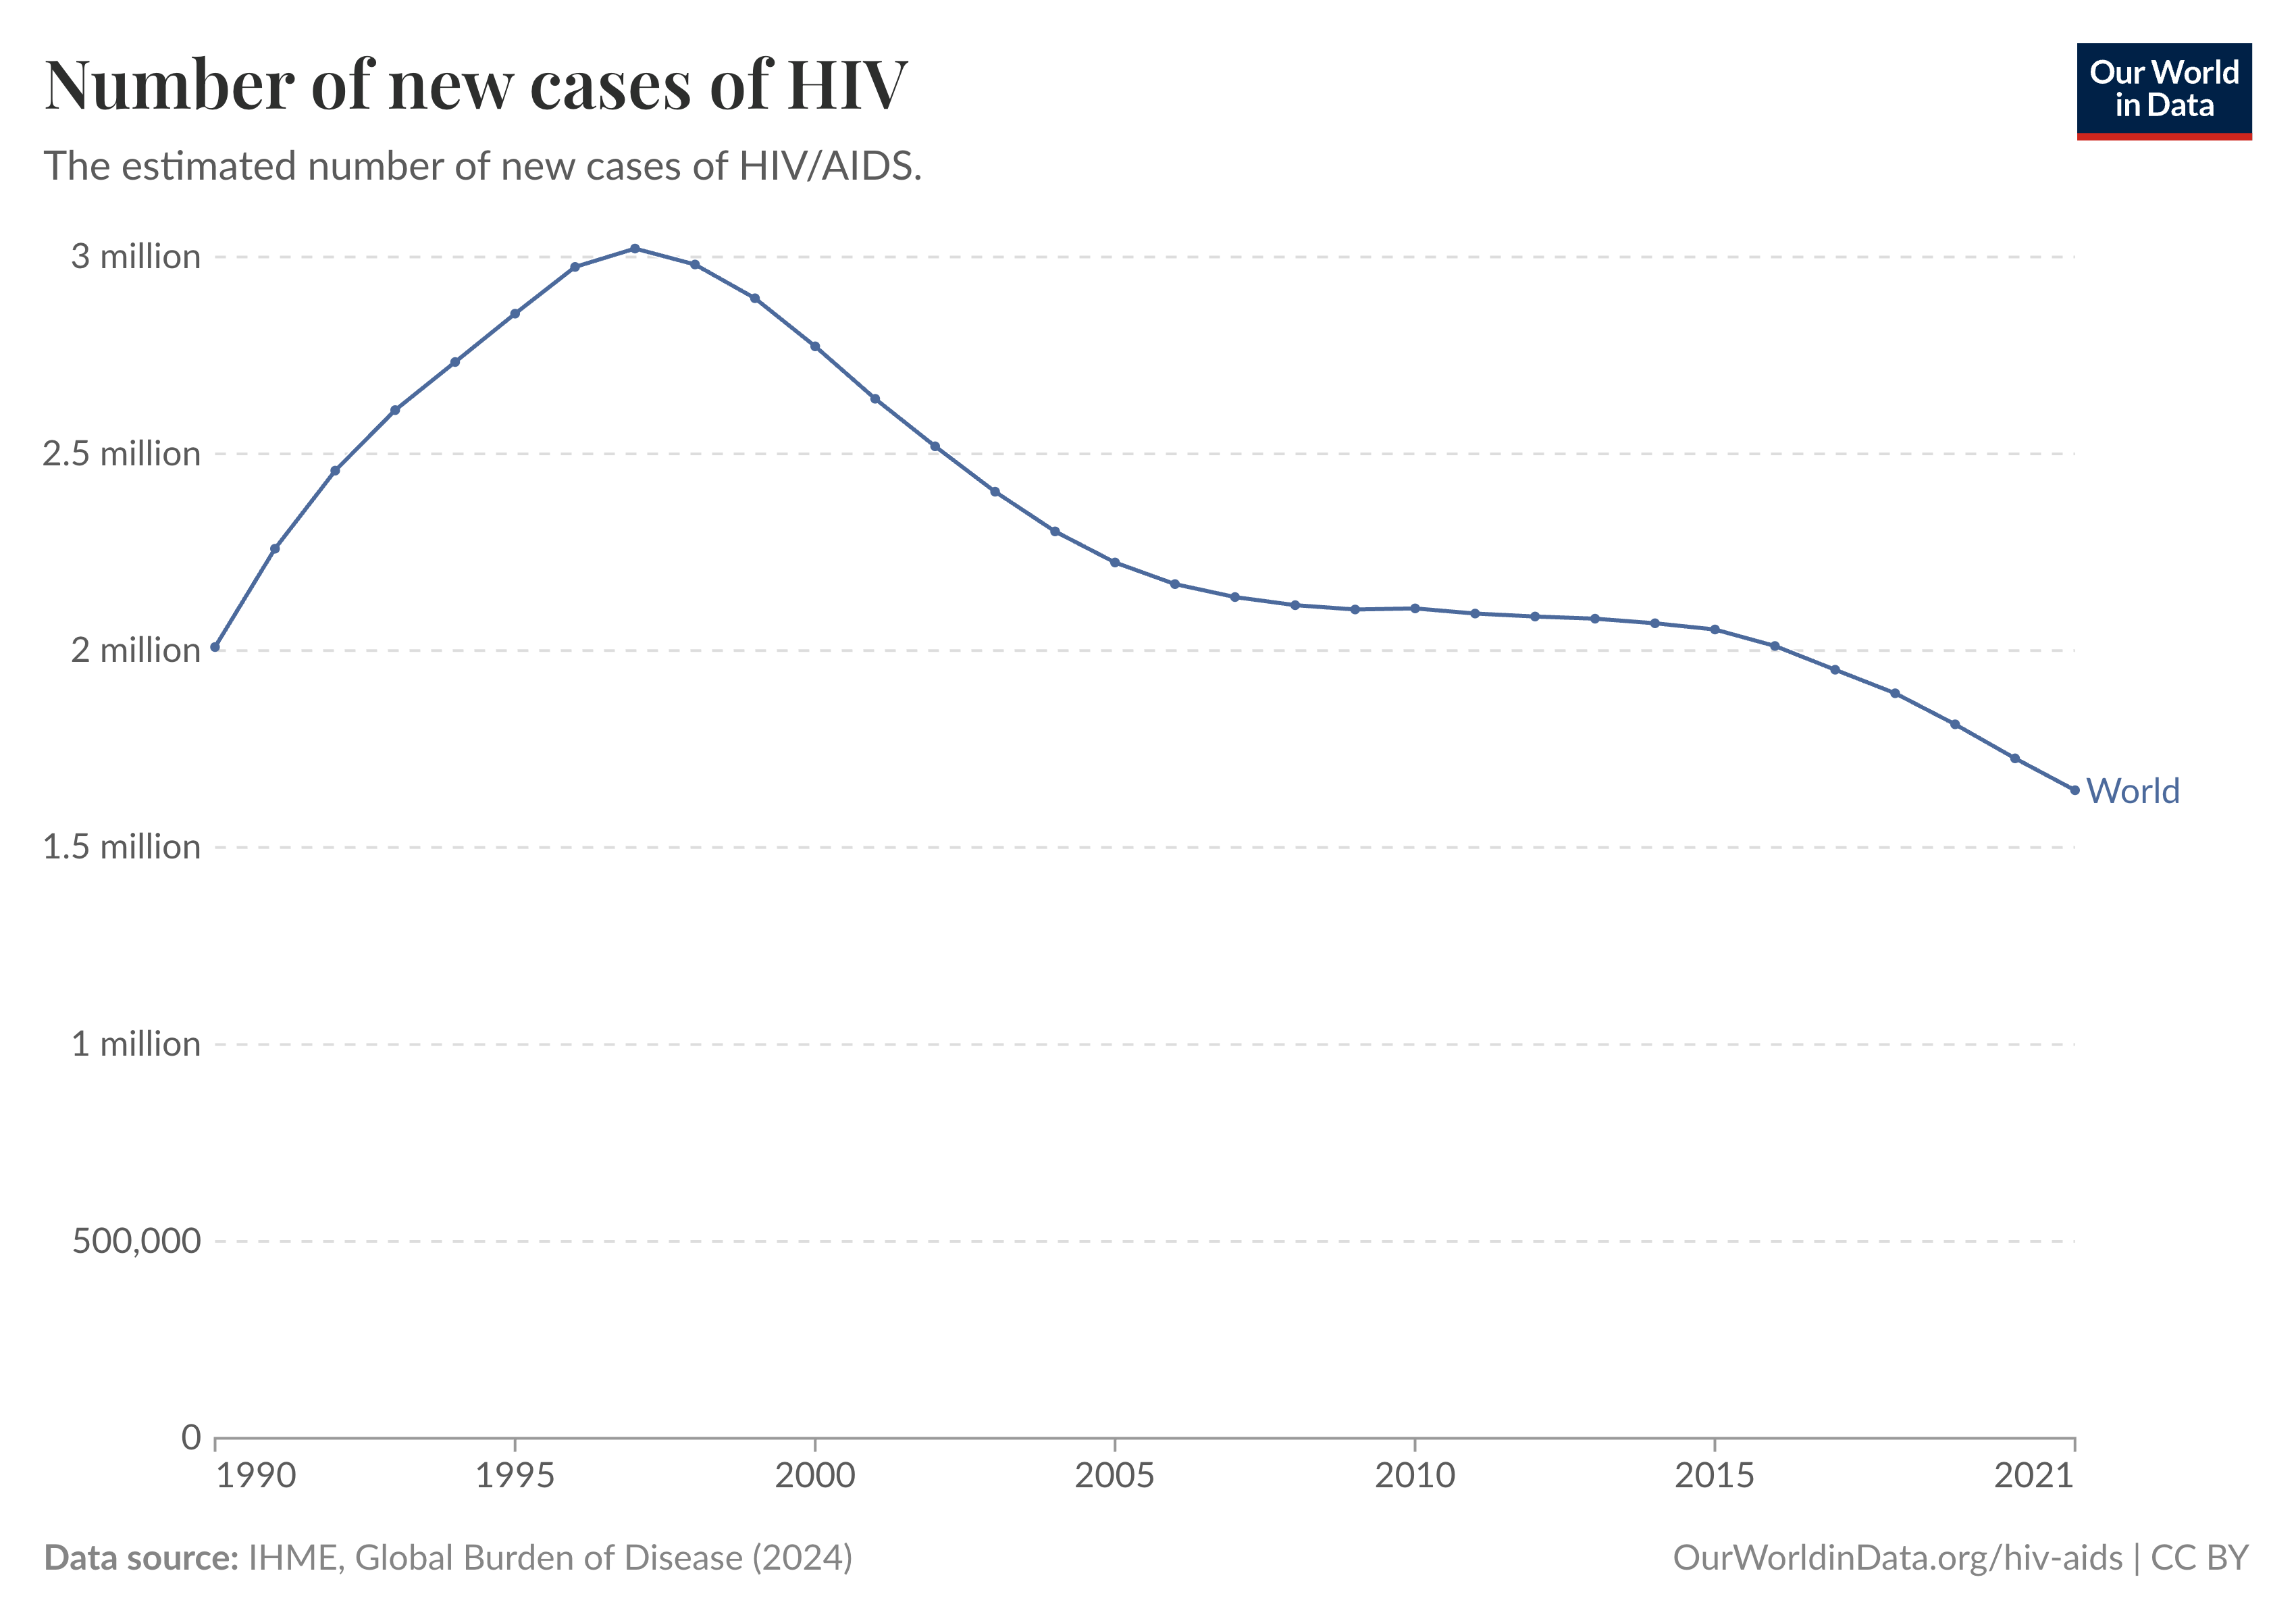 Source: Our World In Data
Operational Realities of Aid Disruption: While not a pruned metric, the inherent unpredictability of how smoothly aid might resume (even with waivers), given potential layoffs and logistical hurdles, adds a layer of unquantifiable uncertainty.
Establish Baselines/Anchors
In this example, we’ve already added baseline numbers in the gather and assess step, so we can skip this for now.
Establish Key Parameters
Two crucial parameters were established:
-
Estimated Annual Excess Mortality Rate (ART): Combining both the studies ((2) and (3)), a reasonable median estimate for excess mortality over each year would be about 2% of a population. And while the 25th and 75th percentile are inexact, Leibowich estimates 1% for the 25th percentile and 3% for the 75th percentile, giving us a range of [1% - 2% - 3%].
-
Adjustment Factor for Non-ART Life-Saving Services (e.g., OVC): If we assume ART accounts for about 80% of lives saved every year through PEPFAR, then the total no. of lives saved 1.25 times the no. of lives saved by ART (since 1/0.8=1.25).
Quantify Uncertainty in Parameters
Vide supra
Build Forecast
-
Initial Impact: Deaths from ART Cessation: Estimated [1% - 2% - 3%] annual excess mortality rate X ~20.6 million baseline of people on PEPFAR ART -> [206,000 - 412,000 - 618,000] deaths per year and a four-year forecast of [812,000 - 1,599,000 - 2,363,000] deaths solely from ART interruption.
-
Adjusted Impact: Incorporating Loss of Non-ART Services: To account for other life-saving services (like OVC), we apply the established 1.25x adjustment factor to the initial figures. The final one-year forecast becomes [257,500 - 515,000 - 772,500] deaths. The final four-year forecast becomes [1,015,000 - 1,998,750 - 2,953,750] deaths.
| Horizon | Scenario | 25th pct (low) | 50th pct (median) | 75th pct (high) | Note |
|---|---|---|---|---|---|
| 1 year | ART only | 206 k | 412 k | 618 k | - |
| 1 year | ART + non-ART | 258 k | 515 k | 773 k | ART only * 1.25 |
| 4 years | ART only | 812 k | 1.60 m | 2.36 m | ART only * 4 |
| 4 years | ART + non-ART | 1.02 m | 2.00 m | 2.95 m | (ART + non-ART) * 4 |